
Decoding the hidden messages in your blood cells can reveal vital insights about your health. The Osmotic Fragility Test (OFT) is a powerful diagnostic tool to assess the resilience of your red blood cells. But what story do these results tell? Whether you're a patient seeking answers or a healthcare professional aiming to provide clarity, you must know the meaning of the test. At the same time, osmotic fragility test interpretation is a multidimensional task for any pathologist too. Oftentimes, the OFT test is only a first step in diagnosis.
In this article, we'll break down the osmotic fragility test interpretation to decode what various values could mean for your health. Continue reading.
Osmotic Fragility Test
Osmotic fragility test is a blood test used to determine the susceptibility of Red Blood Cells (RBCs) to undergo hemolysis, which is rupture or breakdown of cells. It relies on the principle of osmosis, where water moves across a semipermeable membrane from an area of lower solute concentration to higher concentration.
Your blood samples to a series of increasingly hypotonic saline solutions. As the surrounding fluid becomes less concentrated, water moves into the RBCs due to osmosis. This influx causes the cells to swell.
Normal RBCs can withstand some degree of swelling before their membranes rupture (hemolysis). The point at which hemolysis occurs depends on the cell's membrane integrity and cytoskeletal structure. Depending on the fragility point, various health conditions are diagnosed. For example, an osmotic fragility test in hereditary spherocytosis indicates that RBCs are more vulnerable to hemolysis.
Osmotic Fragility Test Procedure
- Prepare a series of hypotonic saline solutions (0.1% to 0.9% NaCl).
- Collect a blood sample from the patient.
- Add a small, equal amount of blood to each saline solution.
- Incubate the mixtures at room temperature for 30 minutes and centrifuge the samples.
- Examine the supernatant for hemolysis.
- Determine the concentration at which hemolysis begins (minimum fragility).
- Identify the concentration at which hemolysis is complete (maximum fragility).
- Compare results to normal reference ranges for accurate osmotic fragility test interpretation.
- Correlate findings in context of possible red blood cell disorders.
Osmotic Fragility Test Interpretation
The results of the OFT test are reported as either positive or negative. A negative result indicates a normal range, while positive result can mean existence of a health issue depending on the range of values.
Osmotic Fragility Normal Ranges
| NaCl Concentration | Condition | Haemolysis Range (Males) | Haemolysis Range (Females) |
|---|---|---|---|
| Unincubated (0.50 g/dL) | Normal | 0%-47.8% | 0%-31.1% |
| Incubated (0.60 g/dL) | Normal | 18.7%-67.4% | 10.9%-65.5% |
| Incubated (0.65 g/dL) | Normal | 4.4%-36.6% | 0.2%-39.3% |
| Incubated (0.75 g/dL) | Normal | 0.8%-9.1% | 0%-10.9% |
Note: Reference values can vary by laboratory. Consult your doctor for specific results interpretation.
Osmotic Fragility Abnormal Results
| Increased Osmotic Fragility | Decreased Osmotic Fragility |
|---|---|
|
Hereditary Spherocytosis Autoimmune Spherocytosis Poisoning Severe Burns Malaria Pyruvate Kinase Deficiency Haemolytic Disease of the Newborn Acquired Haemolytic Anaemia |
Thalassaemia Reticulocytosis Iron Deficiency Anaemia Sickle Cell Anaemia |
Factors Affecting Osmotic Fragility test Interpretation
Interpretation of Osmotic Fragility of RBC and diagnosing associated medical conditions is not straightforward. Various factors have to be taken into consideration as they can influence the test results.
- Temperature: Higher temperatures increase osmotic fragility.
- pH: Lower pH increases fragility, while higher pH decreases it.
- Age of blood sample: Older samples tend to be more fragile.
- Incubation time: Longer incubation can increase fragility.
- Ongoing medications (e.g. aminoglycosides drugs) can alter red blood cell membrane stability.
- Lipid content of RBC membranes: Higher lipid content can decrease fragility.
- Underlying health conditions: Diseases affecting red blood cells can impact results.
Recent blood transfusions, Improper sample handling, Biological differences between people can also affect baseline fragility.
Also check - List of Pathology test interpretation
Osmotic Fragility Curve
The osmotic fragility test curve is a graphical representation of how RBCs respond to varying levels of osmotic stress. It plays an important role in osmotic fragility test interpretation, particularly in cases of hereditary spherocytosis or thalassemia.
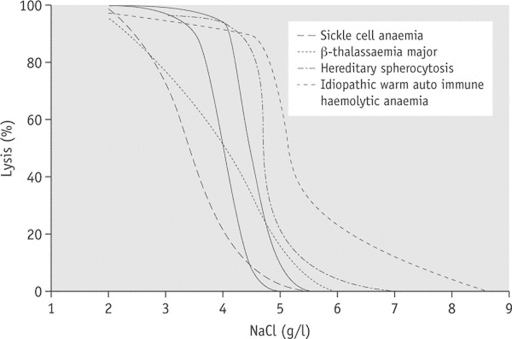
Figure: Osmotic Fragility Curves (The normal range is presented by the unbroken lines).
The point where the curve begins to rise indicates Onset of Hemolysis.
The point where the curve plateaus (100% hemolysis) is complete hemolysis.
Saline concentration at 50% hemolysis is Median Corpuscular Fragility (MCF).
Left Shift indicates increased osmotic fragility (e.g., spherocytosis).
Right shift indicates decreased osmotic fragility (e.g., thalassemia).
Area under the curve represents the overall fragility of the RBC population.
Conclusion
Osmotic Fragility Test interpretation requires a nuanced grasp of haematology and cellular biology. While providing valuable insights into red blood cell health, results must be contextualised within a patient's broader clinical picture. As diagnostic techniques evolve, the OFT remains a foundational tool. Bridging the gap between cellular behaviour and systemic health, guiding clinicians towards more precise diagnoses and tailored treatment strategies.
Also read: Dengue Test Kit Result Interpretation
Get Started at ₹1!
Try Flabs for a full month for just ₹1.
Follow us on