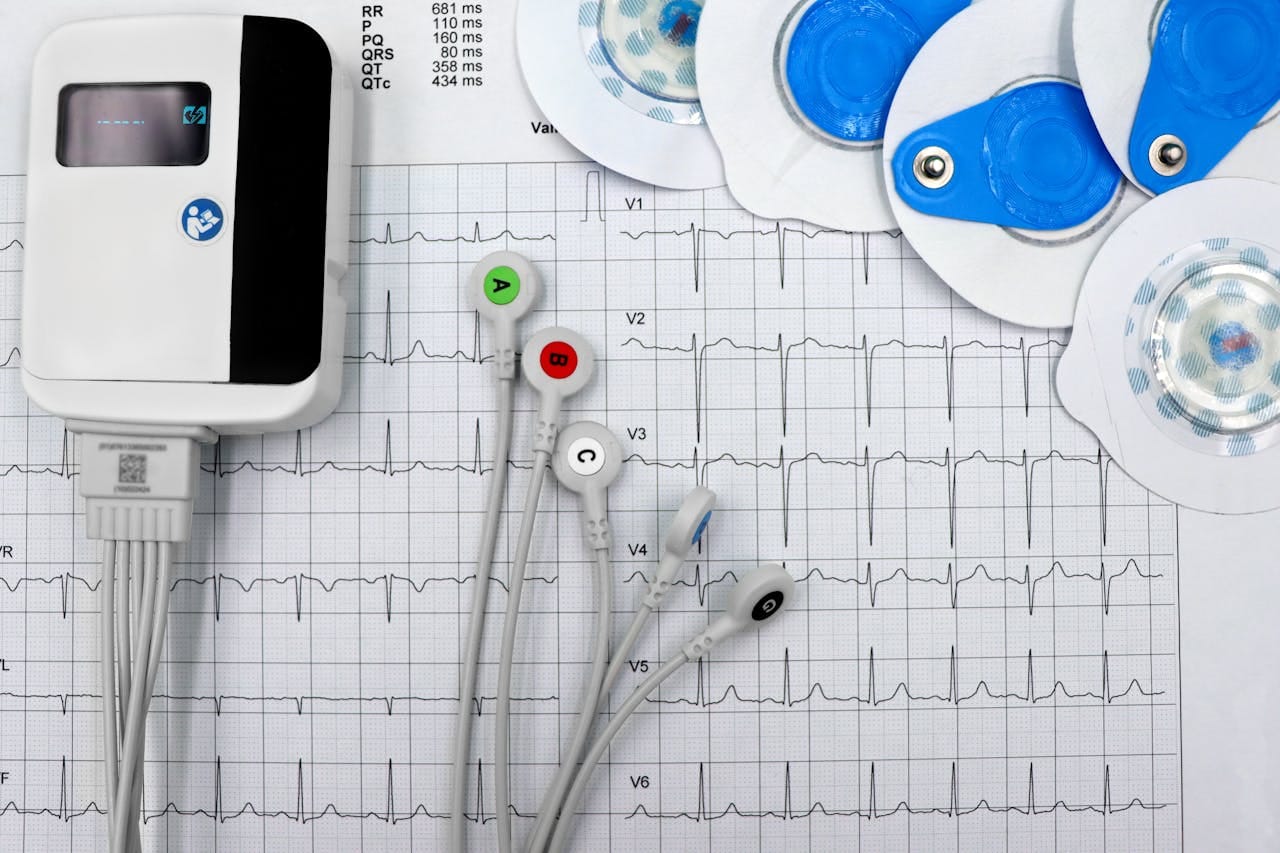
An electrocardiogram (ECG or EKG) is a fundamental and straightforward test that monitors the heart's electrical activity, providing crucial insights into heart health. By recording electrical signals, an ECG helps diagnose conditions like heart attacks and arrhythmias. Available in medical facilities and some personal devices, ECGs are vital for checking on cardiac conditions.
Despite their simplicity, interpreting ECG results can be challenging for those less experienced. Let’s set out to simplify the ECG test interpretation, offering practical insights into your heart health from a known viewpoint.
What is an Electrocardiogram Test (ECG)?
An electrocardiogram (ECG) is a test used to diagnose certain heart conditions by measuring the electrical activity of the heart. During the test, small sticky dots called electrodes are placed on your chest, arms, and legs. These electrodes are connected to an ECG machine with wires. The machine records the electrical signals produced by the heart and displays them as a trace on a screen or paper.
When do you Need it?
Chest Pain: To identify if the pain is related to a heart attack or other heart conditions.
Irregular Heartbeat: To diagnose arrhythmias or abnormal heart rhythms.
Unexplained Fatigue: To check if it’s due to heart problems.
Shortness of Breath: To determine if heart issues are the cause.
Pre-Surgery: To assess heart health before certain surgeries.
Routine Checkup: For monitoring heart conditions or during regular health evaluations.
Follow-Up: To track changes or monitor treatment for known heart conditions.
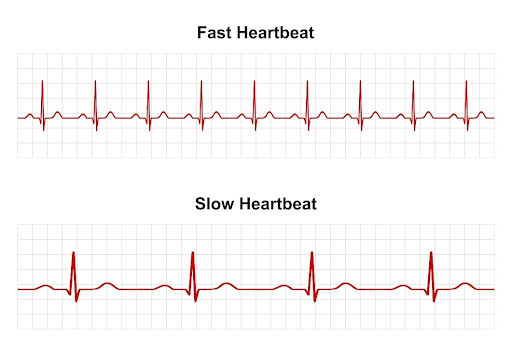
An ECG Record Example
Electrocardiogram Test Procedure
Before the Test
You may need to change into a hospital gown. The healthcare team might shave the area where electrodes will be placed for better adhesion. You'll lie down on an exam table or bed.
During the Test
Sticky patches (electrodes) are attached to your chest, arms, or legs. Wires connect these to a computer that records your heart's electrical signals. You can breathe normally but must stay still and avoid talking to ensure accurate results.
After the Test
You can usually go back to your normal activities unless urgent treatment is needed.
ECG Test Interpretation
ECG test interpretation is required to diagnose any underlying health conditions based on your symptoms and clinical history. The results will be on the same day or at your next appointment. Typically, the following conditions are checked for during the ecg interpretation.
- Heart Rate: Measures beats per minute. Useful for diagnosing tachycardia (fast heart rate) or bradycardia (slow heart rate) when the pulse is hard to measure.
- Heart Rhythm: Reveals the time and pattern between beats. Helps identify arrhythmias like atrial fibrillation or flutter.
- Heart Attack: Diagnoses current or past heart attacks by showing which part of the heart may be damaged.
- Blood and Oxygen Supply: Evaluate if chest pain is due to reduced blood flow to the heart.
- Heart Structure: Detects changes such as an enlarged heart or congenital defects.
In case of any abnormalities, your doctor may suggest going for a chest X-ray, physical examination, echocardiogram, CT and MRI scans of your chest, and blood tests to have further insight into your health condition.
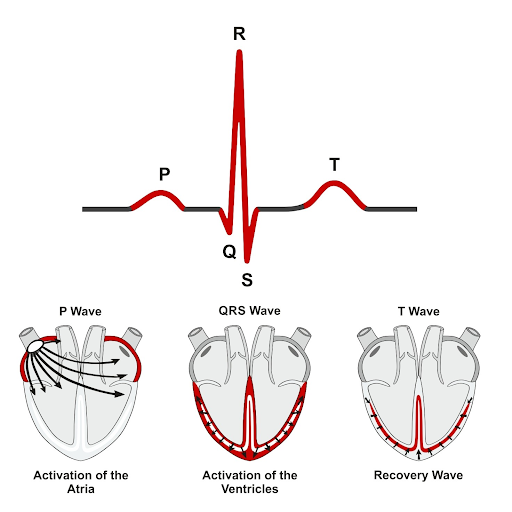
An ECG graph might look confusing at first, but it provides important details about your heart's electrical activity. The graph shows waves and intervals like the P-wave, QRS complex, and T-wave, each representing different stages of your heartbeat. Learning about these parts helps you understand your heart rhythm better.
How to Read ECG Report
| Aspect | Details |
|---|---|
| Patient Details | - Name, DOB, hospital number - Location for moving patients |
| Situation Details | - ECG timing - ECG number in a series - Note symptoms (e.g., chest pain) or relevant clinical info |
| Measuring Rate | - Count QRSs on one line and multiply by six - Count large squares between R waves and divide 300 by this number |
| Assessing Rhythm | - Check if rhythm is regular or irregular - Use the paper test for regularity |
| Assessing Axis | - Normal axis: positive deflections in leads I and aVF - Deviations: Right axis (I negative, aVF positive), Left axis (I positive, aVF negative) |
| P-Wave and PR Interval | - Check for visible P-waves and their association with QRS - Assess P-wave morphology and PR interval changes |
| Q-Wave and QRS Complex | - Q-wave: normal if small; pathological if large or in wrong leads - QRS width: < 0.12 secs normal; wide QRS indicates conditions like bundle branch blocks |
| ST Segment | - Should be flat - Elevation or depression >1mm in leads may indicate issues like myocardial infarction or ischemia - High-takeoff is a benign variant, often mistaken for elevation |
| QT Interval | - Measures time from Q-wave start to T-wave end - QTc corrects for heart rate; a prolonged QTc can be a sign of various conditions |
| T-Wave | - Can be flat or inverted - Peaked T waves indicate hyperkalaemia; flat or inverted T waves may indicate other issues |
Analysing QRS Morphology
| ECG Feature | Description | Indicators |
|---|---|---|
| Delta Wave | Early ventricular activation causes a slurred QRS complex. | Alone, it doesn't diagnose Wolff-Parkinson-White syndrome. |
| Q Waves | Pathological if very large or wide. | Isolated Q waves can be normal; multiple may indicate a past heart attack. |
| R and S Waves | R wave should increase from V1 to V6; the transition should be in V3/V4. | Poor progression may suggest a past heart attack or bad lead placement. |
| J Point Segment | The point where the S wave meets the ST segment; can be elevated (high take-off). | Normal in younger people; widespread elevation is benign. |
| ST Segment | Should be flat. | Elevation may signal a heart attack; depression suggests ischemia. |
| T Waves | Shows how the heart recovers. | Tall T waves: Hyperkalaemia or STEMI. Inverted: Assess in context. |
| U Waves | Small wave after T wave; seen in V2/V3. | Larger with slow heart rate; linked to imbalances or certain medications. |
ECG Reading Normal and Abnormal
A normal ECG graph reading shows consistent wave shapes and intervals for a healthy heart. Deviations may signal arrhythmias or other issues. Doctors compare results to standards to decide if further investigation or treatment is needed.
Detecting Irregular Heart Rhythms
An ECG identifies irregular heart rhythms, like atrial fibrillation or ventricular tachycardia, through specific patterns. Early detection helps prevent complications.
Unveiling Heart Attacks and Ischemia
ECGs diagnose heart attacks and ischemia by detecting changes in the ST segment. Elevated or depressed segments can indicate coronary artery blockages, prompting timely treatment to protect heart function.
Chck list of all Pathology Tests Interpretation
Conclusion
While we have a hold on basic aspects of ECG test interpretation, remember that personal health context and history are imperative for a complete diagnosis. An ECG is just one part of the whole cardiac assessment. Discuss your results with your healthcare provider to know how they fit with other tests and your overall health. Effective treatment often relies on a combination of tests and clinical judgment tailored to your individual needs.
Also read: RT-PCR Test Result Interpretation
Get Started at ₹1!
Try Flabs for a full month for just ₹1.
Follow us on