Flabs
Hemocytometer: A Vital Tool for Accurate Cell Counting
Manual cell counting is one of those lab tasks that looks simple on the surface. But when you get it wrong, downstream clinical decisions pay the price. In busy pathology labs across India, where sample volumes are high and turnaround expectations are tight, accuracy is not negotiable. The stakes are too high in the ways of multiple operations.
That's exactly where the hemocytometer earns its place among the lab equipment. It hastens cell counting and makes it super-easy for lab professionals to focus on faster outcomes.
What is a Hemocytometer in Pathology?
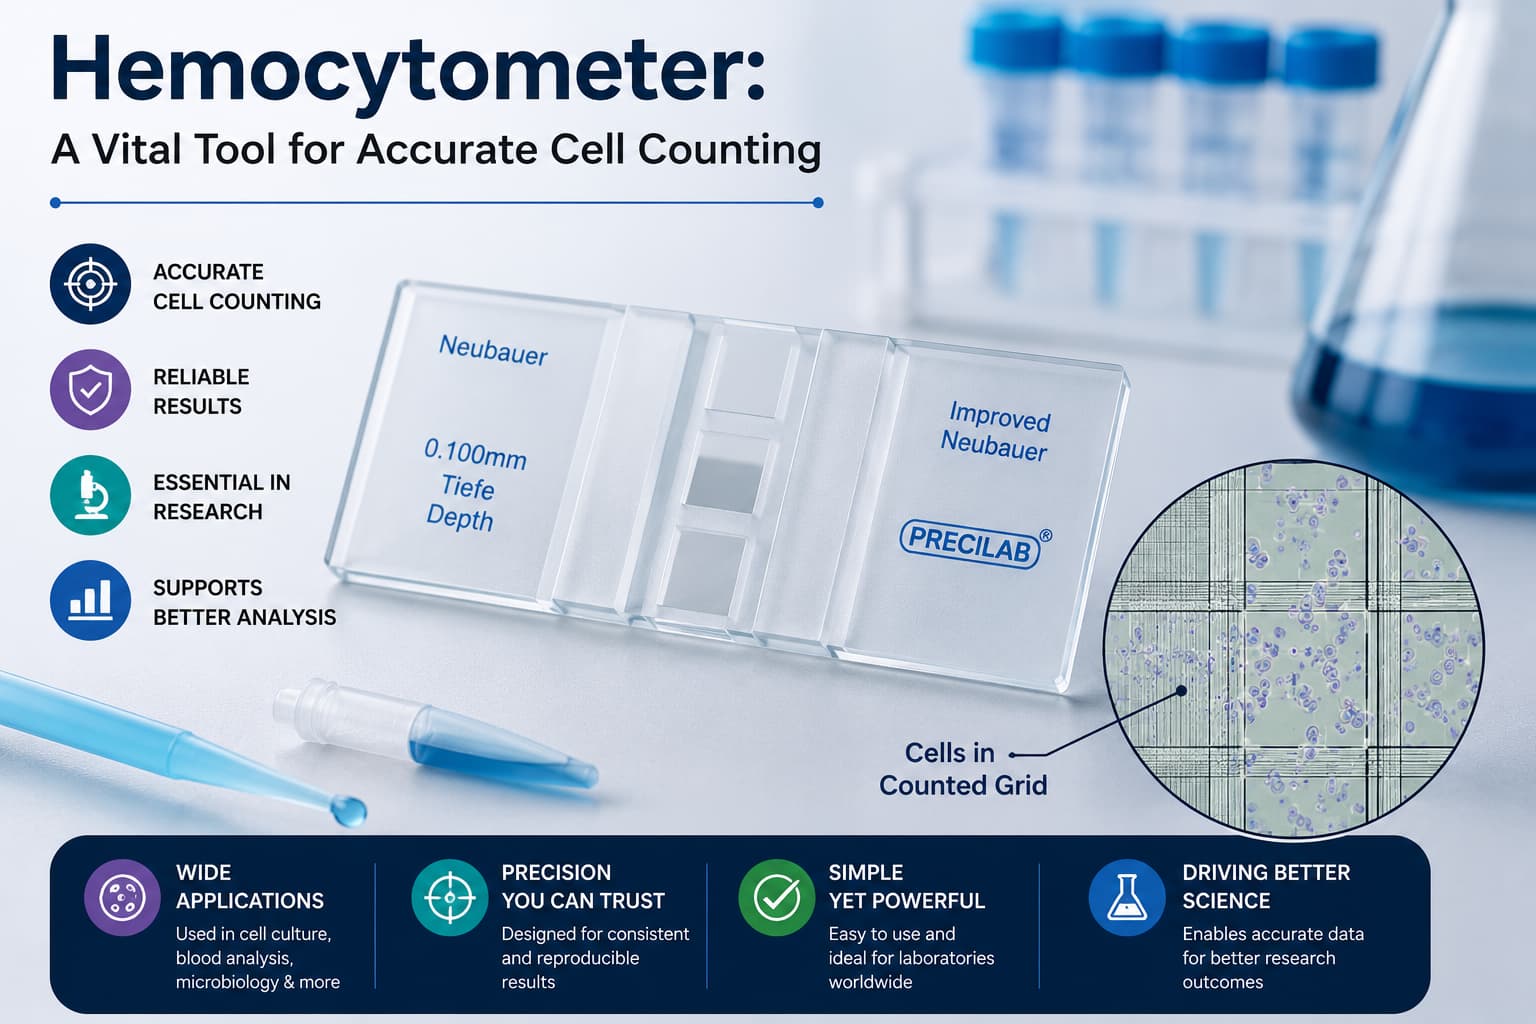
A hemocytometer is a specialised microscope slide designed for counting cells in a defined liquid volume. Built with a precision-etched counting grid and a fixed depth, it gives you a reproducible way to measure cell concentration in any suspension, whether blood or cultured cells.
Originally developed for counting blood cells, the hemocytometer now sees far wider use: total cell count, cell viability testing, sperm count analysis, yeast and bacterial cultures, and more.
Despite the rise of the flow cytometer in advanced diagnostics, the hemocytometer is the go-to for routine labs and resource-limited settings. It is affordable, immediate, and doesn't require a complex instrument.
The Hemocytometer Principle: Count Cells, Calculate Concentration
The hemocytometer principle is straightforward: count cells in a known volume, then extrapolate to cells per milliliter.
A modern hemocytometer chamber has a ruled grid area of 3×3 mm (nine large squares). Each large square is 1×1 mm. With a standard cover slip, the depth is fixed at 0.1 mm; each large square holds a volume of 0.1 mm³ (or 0.1 µL). That fixed geometry is what makes hemocytometer cell counting mathematically reliable.
Structure of the Hemocytometer Counting Chamber
| Component | Dimension | Volume |
|---|---|---|
| Total grid area | 3×3 mm | — |
| Each large square | 1×1 mm | 0.1 µL |
| Chamber depth (fixed) | 0.1 mm | — |
| Ideal cell concentration | — | ~10⁶ cells/mL |
| Acceptable range (Neubauer) | — | 2.5×10⁵ to 2.5×10⁶ cells/mL |
The 9-square grid is subdivided further to accommodate different cell sizes. Corner squares are generally used for RBC or WBC counts; the central square with its finer grid is used for platelets or smaller particles.
If your sample falls outside the acceptable concentration range, dilute or concentrate it before loading. Always record the dilution factor. You'll need it for the final calculation.
How to Use a Hemocytometer: Step-by-Step
Clean the chamber and cover slip: Any residue skews your count.
Mix your sample thoroughly: Uniform cell suspension is non-negotiable.
Stain if needed: Trypan blue is the standard for viability; live cells exclude the dye, dead cells stain blue.
Load ~10 µL of sample: Let it fill by capillary action. Don't overfill or underfill.
Focus under the microscope: Allow cells to settle for ~1 minute before counting.
Count using your chosen strategy: Apply consistent rules throughout.
Record live and dead cells separately: Required for viability calculations.
Counting Strategies
Logical count (4 corners + center): The most common method. Balances speed and reliability.
Absolute count (all 9 squares): More time-intensive, but more accurate.
Quick count (2 diagonal squares): Faster for rough screen, but less reliable.
The Counting Rule You Can't Skip
Count cells touching the top and right borders. Exclude cells touching the bottom and left borders. This boundary rule exists to prevent double-counting cells that straddle grid lines. Every person counting in your lab needs to apply the same rule, every time.
Hemocytometer Calculation Formulas
The following mathematical formulas are used for mainly two calculations in call counting.
1. Hemocytometer Cell Count Formula: Cell Concentration
Cells/mL=Average count×Dilution factor×104
The 10⁴ factor converts from the volume of one large square (0.1 µL) to cells per mL.
Example: If your average count across the squares is 50, and your dilution factor is 10: 50×10×104=5×10⁶ cells/mL
2. RBC Calculation Formula: Cell Viability
For hemocytometer RBC count or any viability assessment using trypan blue.
Cell Viability (%)=(Live Cells + Dead CellsLive Cells)×100
If you counted 80 live cells and 20 dead cells (100 total): viability = 80%.
Where Errors Come From
Studies put hemocytometer counting errors at 20–30%. That's significant. Here's what causes them.
Uneven cell distribution: Poor mixing before loading.
Incorrect dilution: Sample too dense or too sparse.
Poor pipetting: Often uncalibrated pipettes and Inconsistent volumes.
Miscounting: Not following the boundary rule.
Debris misidentified as cells: Especially with unstained samples.
Inconsistent method across staff: Different people using different strategies.
To reduce errors, count at least three times and average the results, work with a consistent technique, and train all lab staff on the same protocol.
In pathology labs in India, multiple technicians handle samples across shifts. Hence, standardization is what separates reliable data from guesswork.
Uses in Modern Medical Labs
- RBC and WBC differential counts in haematology.
- Sperm concentration in andrology.
- Cell viability in research and bioprocessing.
- Yeast and bacterial cell counts in microbiology tests.
- Platelet estimation in coagulation tests.
- CSF cell counts in neurology.
While the flow cytometer handles high-volume, high-complexity immunophenotyping and cell sorting, the hemocytometer is for routine quantification. It is an important lab equipment among accessible, low-overhead tools.
Managing Cell Count Data with an LIS System
Manual counting produces data. Data needs to go somewhere accurate, fast, and retrievable. In high-volume settings, a paper-based system for recording hemocytometer results creates problems and audit risks.
FLABS LIS is an AI-powered laboratory information system trusted by 2,000+ NABL-accredited labs across India.
For labs running manual hemocytometer counts alongside automated tests, FLABS brings everything into one system: TAT Management, AI Flagger, AI Smart Report, Quality Control (QC), Bulk Actions via WhatsApp, SMS, or email in one click, Dynamic QR Code & Barcode for every report.
The Bottom Line
The hemocytometer has is a standard tool in pathology labs for over a century. Not because nothing better exists, but because it does its job reliably when used correctly. Know the chamber geometry, apply the right hemocytometer calculation, follow the counting rules without shortcuts, and repeat your counts. The math is simple. The discipline is what makes the difference.
For pathology labs in India scaling up operations, pairing precise manual technique with a capable LIS like FLABS is the practical path to consistent, audit-ready results.
If your lab runs hemocytometer counts daily, FLABS keeps the data trail clean from count to report to patient delivery.
Start a 5-Day Free Trial with FLABS and see how 2,000+ NABL labs are cutting TAT and eliminating reporting errors.
Also check - Coagulometer and Flow Cytometer